
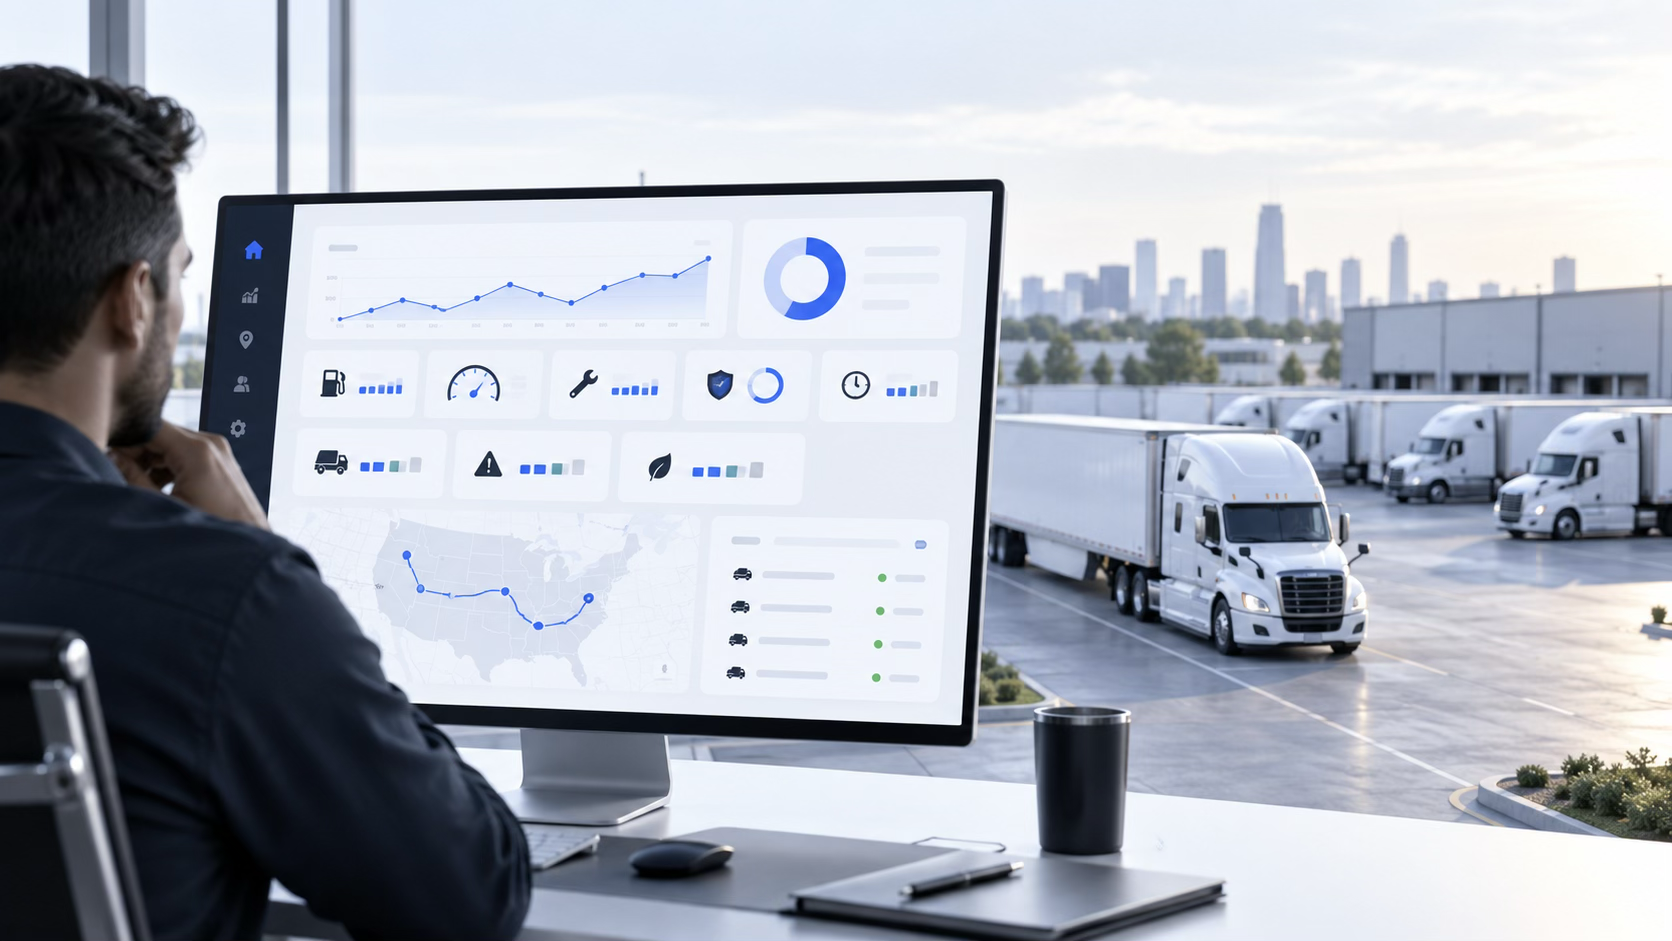
Good fleet management KPIs turn operating data into a small set of measures leaders can actually use. The purpose is not to track everything. It is to understand whether the fleet is getting safer, more productive, more reliable, and more cost-efficient.
The right key performance indicators should reflect how the business operates. A dedicated carrier, regional truckload fleet, and private fleet may use different benchmarks, but the core categories are similar: cost, asset use, fuel, maintenance, service, driver performance, and safety.
Below are 15 practical fleet management metrics to build into a recurring operating review.
1. Cost per Mile
What it measures: Total operating cost divided by miles driven over the same period.
Why it matters: Cost per mile provides a common unit for comparing changes in fuel costs, labor, insurance, maintenance costs, tires, tolls, and other expenses. It is one of the clearest measures for cost management because it connects spending to actual fleet output.
How to use it: Break the metric into major cost categories instead of reviewing only the blended number. That makes it easier to see whether a change comes from fuel, maintenance, utilization, or another factor.
2. Total Cost of Ownership
What it measures: The full lifecycle cost of owning and operating a vehicle or asset.
Why it matters: Total cost of ownership, or TCO, goes beyond purchase price. A practical TCO view can include financing, depreciation, fuel, insurance, maintenance, taxes, downtime, and disposal value.
How to use it: Compare similar equipment classes and replacement cycles. Fleet leaders can use TCO to evaluate whether an older unit’s repair costs and vehicle downtime still justify keeping it in service.
3. Vehicle Utilization
What it measures: How much of an asset’s available capacity or time is being used productively.
Why it matters: Low vehicle utilization can indicate excess capacity, maintenance bottlenecks, weak planning, or freight imbalances.
How to use it: Define utilization consistently. Depending on the fleet, that may mean revenue miles, active hours, days in service, loaded miles, or another operational measure.
4. Vehicle Downtime
What it measures: Time an asset is unavailable because of maintenance, repair, inspection, or another operational issue.
Why it matters: Downtime reduces productive capacity and can create secondary costs such as rentals, recovery moves, missed loads, and driver disruption.
How to use it: Separate planned from unplanned vehicle downtime. A rising share of unplanned downtime often deserves a closer look at parts, inspection quality, recurring faults, and scheduled maintenance execution.
5. Preventive Maintenance Compliance
What it measures: The percentage of scheduled preventive maintenance work completed on time.
Why it matters: Strong preventive maintenance compliance, often called PM compliance, helps fleets reduce avoidable breakdown risk and makes maintenance planning more predictable.
How to use it: Track overdue units by days or miles past due, not just a single percentage. Connect preventive maintenance schedules with driver vehicle inspection reports, or DVIRs, to identify issues earlier.
6. Maintenance Cost per Vehicle or Mile
What it measures: Maintenance spend normalized by unit, mile, or operating hour.
Why it matters: Rising maintenance costs can reflect aging equipment, parts inflation, poor PM execution, repeat failures, or weak warranty recovery.
How to use it: Split planned maintenance from unscheduled repair costs. Look for outlier vehicles and recurring components rather than relying only on a fleetwide average.
7. Fuel Efficiency
What it measures: How efficiently vehicles convert fuel into miles or productive work.
Why it matters: Fuel efficiency has a direct effect on fuel costs and total operating cost. Common measures include miles per gallon and other forms of fuel economy.
How to use it: Avoid judging drivers on raw MPG alone. Fuel consumption and fuel usage can be influenced by equipment, terrain, weather, route, load weight, speed, and idling. Use telematics data to add operating context.
8. Idle Time
What it measures: Time a vehicle is running while not moving or not performing productive work.
Why it matters: Idle time, idling, and excessive idling can increase fuel use and engine hours without creating miles.
How to use it: Separate necessary idle from avoidable idle. Long dwell, extreme temperatures, PTO use, and customer processes can create legitimate idling, so operational context matters.
9. On-Time Delivery Rate
What it measures: The percentage of deliveries completed within the agreed service window.
Why it matters: On-time delivery rate connects fleet execution directly to customer service.
How to use it: Pair the KPI with root-cause categories such as late dispatch, appointment delay, breakdown, traffic, shipper delay, receiver delay, or HOS constraints. Route optimization can improve planning, but the metric is most useful when teams understand why a miss occurred.
10. Accident Rate
What it measures: Preventable or reportable accidents normalized by miles, drivers, vehicles, or another consistent exposure measure.
Why it matters: Accident rate is a core fleet safety indicator and should be reviewed with severity, preventability, and exposure in mind.
How to use it: Avoid looking only at lagging events. Pair accident results with leading indicators such as coaching completion, speeding, seat belt use, and near misses.
11. Safety Incident Rate
What it measures: The frequency of defined safety events, which may include collisions, citations, policy violations, or other reportable incidents.
Why it matters: A safety incident rate gives leaders another view of driver safety and risk beyond accidents alone.
How to use it: Keep definitions stable across reporting periods. Review harsh braking and other driver behavior signals as context, not as automatic proof of unsafe driving.
12. Driver Productivity
What it measures: Productive output per driver over a defined period.
Why it matters: Driver productivity can reveal planning friction, detention, weak asset availability, communication delays, or inefficient workflows.
How to use it: Choose a measure that fits the operation, such as miles, stops, loads, revenue, or productive hours. Make sure HOS limits, route complexity, customer dwell, and assignment type are accounted for before comparing drivers.
13. DVIR Defect Closure Time
What it measures: The time between a reported vehicle defect and verified resolution.
Why it matters: DVIRs create a direct link between drivers and vehicle maintenance. Slow closure can leave safety or reliability issues unresolved.
How to use it: Track high-severity defects separately and connect reports to work orders, parts status, inspection notes, and return-to-service decisions.
14. Planned vs. Unplanned Maintenance Ratio
What it measures: The share of maintenance work that is scheduled compared with reactive work.
Why it matters: A healthier maintenance program generally aims to identify more work before it becomes a road failure. This KPI complements PM compliance and helps explain changes in repair costs and downtime.
How to use it: Review recurring failure types and whether defects were visible in inspections or telematics systems before a breakdown occurred.
15. Total Operating Cost Trend
What it measures: The change in total operating cost over time, ideally normalized for fleet size and output.
Why it matters: This KPI helps leaders see whether gains in one area are being offset elsewhere. Better fuel economy does not help much if maintenance, downtime, or accident costs rise faster.
How to use it: Review the trend with cost per mile, TCO, utilization, and service metrics. A single KPI rarely explains the full story.
How Telematics Improves Fleet Management KPIs
Most fleets already generate large amounts of fleet data through TMS platforms, ELDs, maintenance systems, fuel cards, and fleet management software. The challenge is turning that data into usable decisions.
Telematics and connected telematics systems can provide real-time location, engine, idle, and driving-event data. Combined with maintenance and dispatch records, this creates a stronger picture of fleet performance.
For example, a spike in fuel consumption can be compared with idling, route changes, vehicle condition, and driver behavior. Higher downtime can be compared with PM compliance, repeat repairs, and DVIR history. The point is not simply to collect more numbers; it is to connect them.
Hyperscale’s Terminal is designed around that cross-system problem. It sits on top of existing trucking systems and helps operators gather context across sources so the human team does not have to manually become the integration layer.
Set Benchmarks That Match Your Operation
There is no universal target for every KPI. Useful benchmarks should account for fleet type, equipment, geography, freight profile, customer requirements, and operating model.
Start with your own baseline. Then ask whether performance is improving, stable, or deteriorating. Over time, external benchmarks can add context, but consistent internal measurement is usually the first requirement for data-driven decisions.
Turn Fleet Management Metrics Into Action
The best KPI program is a management rhythm, not a dashboard project. Choose a focused set of fleet management KPIs, define each calculation, assign an owner, set a review cadence, and connect outliers to action.
That turns data about fuel, fleet operations, maintenance, utilization, service, and safety into a practical system for improving performance. When the underlying data is connected, fleet leaders can spend less time reconciling reports and more time deciding what to change.
About Hyperscale Systems
Hyperscale Systems has pioneered a unified AI command center that transforms operational communications across physical industries. Founded by logistics technology veterans with deep expertise from leading companies like Samsara, Hyperscale integrates seamlessly with major TMS, FMS, and telematics providers to deliver contextual agentic workflows that eliminate operational bottlenecks while enhancing human capability.